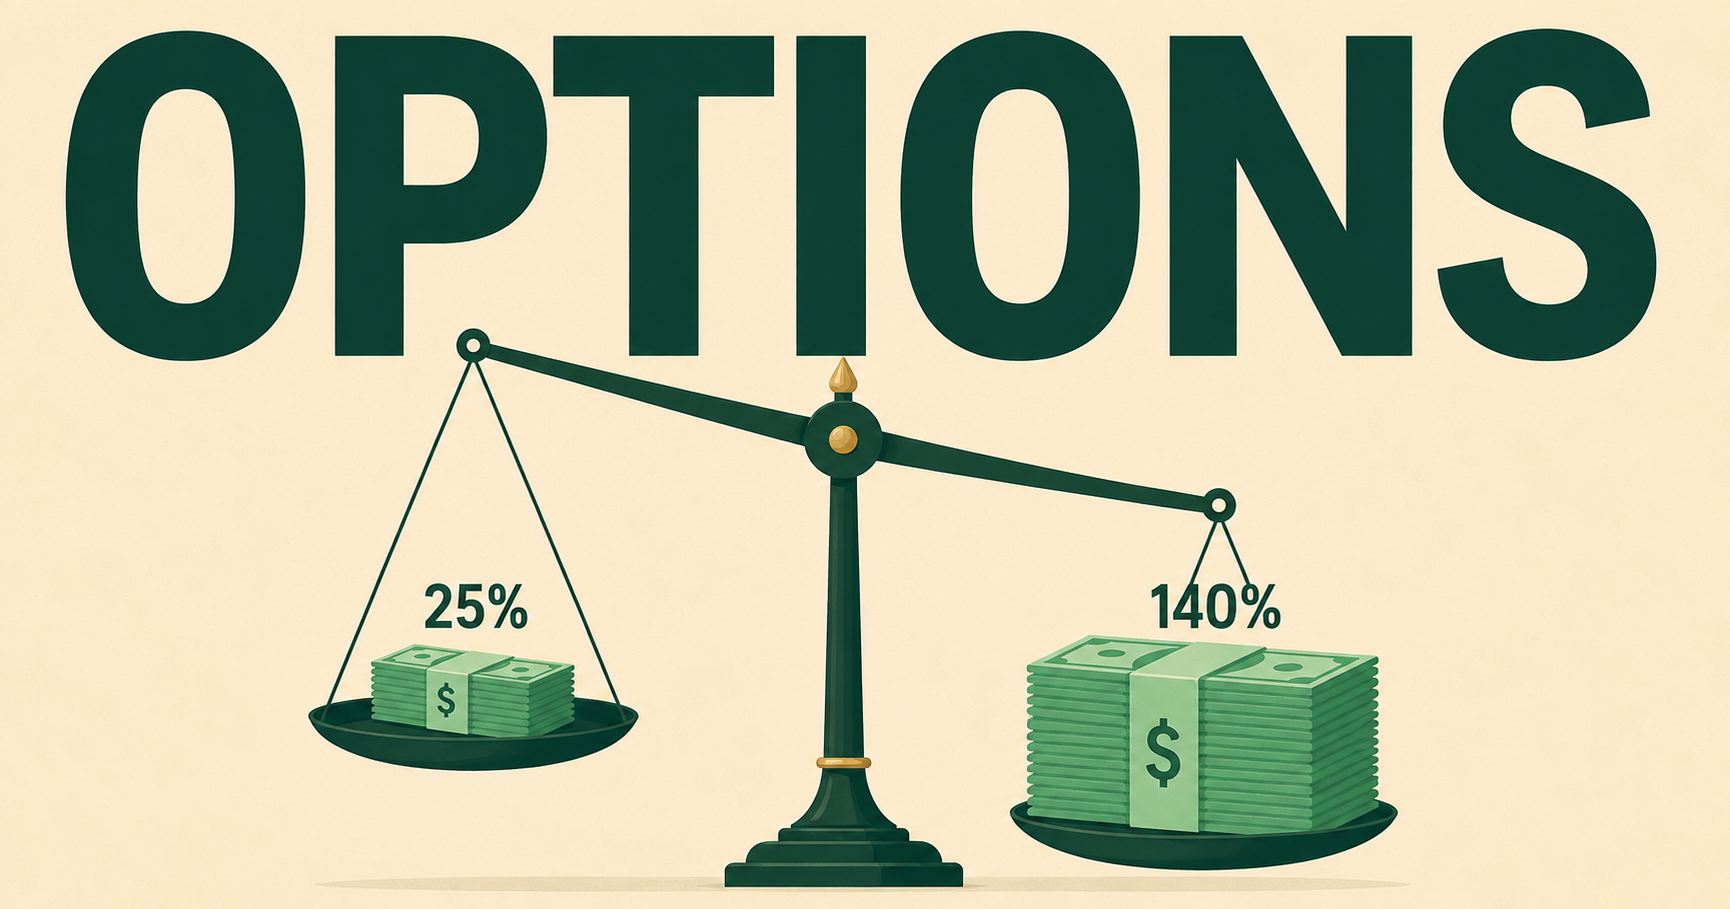
How I Made 140% on a Stock That Only Moved 25%
HEY YOU! THANKS FOR BEING HERE. A QUICK NOTE:
THE EXAMPLE BELOW IS NOT INVESTMENT ADVICE.
With that said, optionality is an asset, and a growing number of investors are reaching for it.
If you’ve never traded one, an option is a contract that gives you the right to buy or sell a stock at a set price by a set date, without obligating you to do it. You pay a fee up front for that right. If the stock cooperates, the contract becomes worth more and you can sell it or exercise it. If it doesn’t, the contract expires and the fee is gone.
That last part is the whole risk, and it’s worth saying plainly before anything else. What you pay for a contract is what you can lose, all of it, and losing all of it is common rather than exotic.
Two more terms and you can read the rest of this without a glossary. The strike is the price written into the contract. The premium is what you paid for it. One more piece of arithmetic that catches nearly everyone: options are quoted per share but sold in lots of 100, so a contract quoted at $11.37 costs $1,136.67.
That’s enough to follow along. The rest of it gets built up as we go.
Here’s why any of this matters right now.
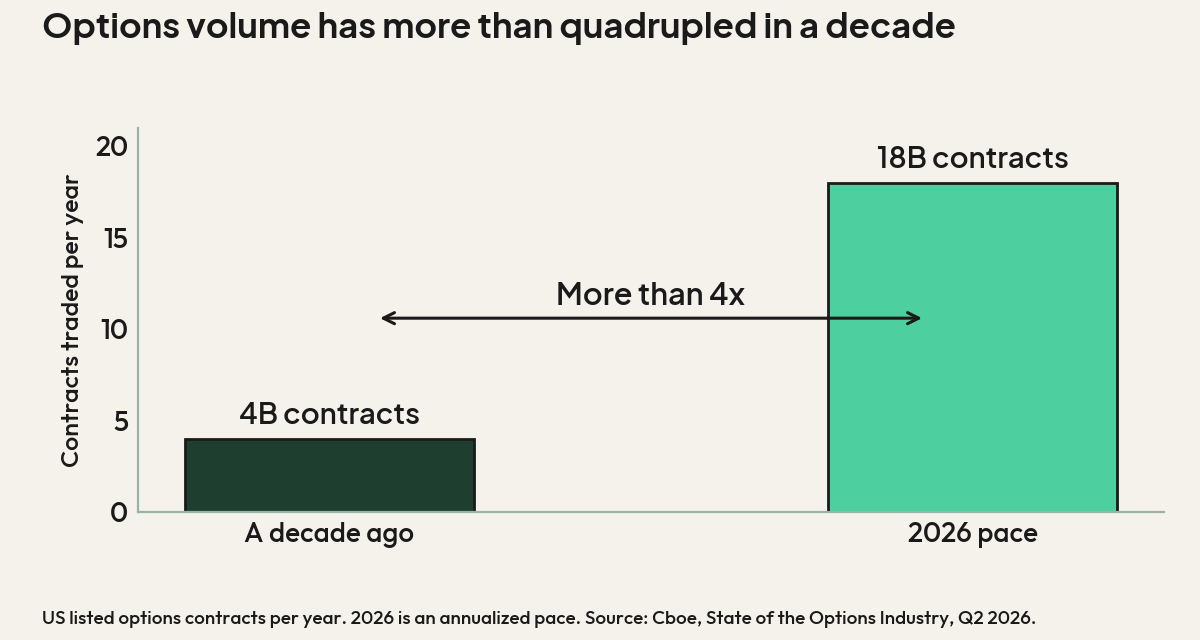
Average daily options volume hit 72.8 million contracts in the second quarter, up more than 19% from a year earlier. May set the all-time single-day record at over 73 million. A decade ago the entire US market cleared roughly 4 billion contracts in a year. This year the pace runs well above 18 billion.
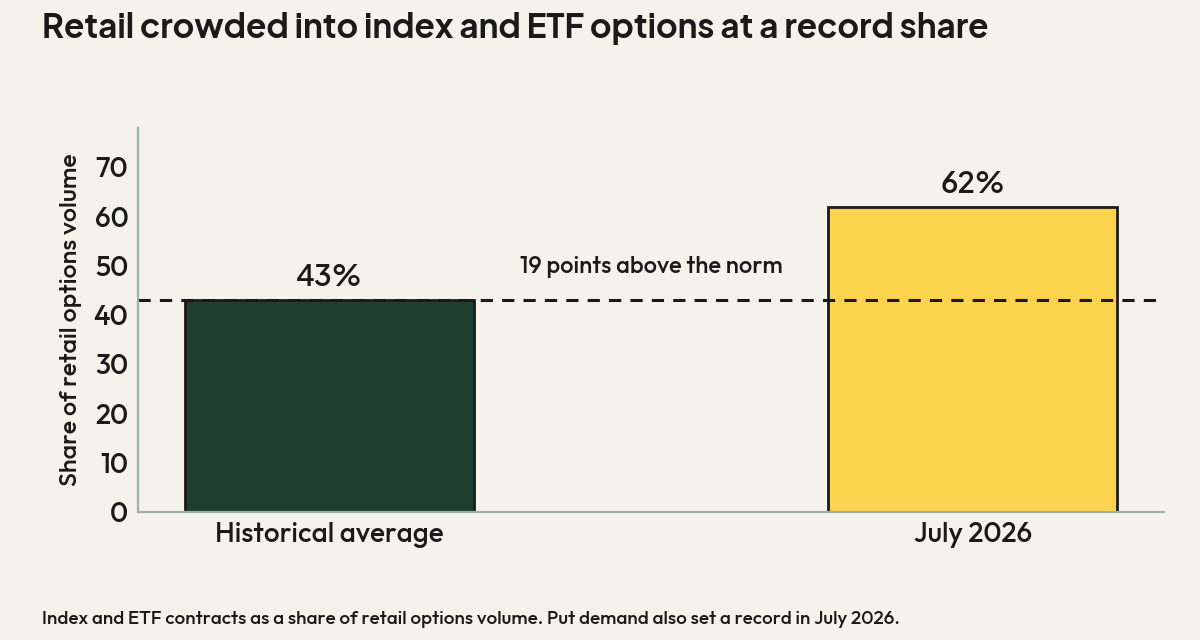
Then July happened, and the character of that volume changed. Put demand set a record. Index and ETF contracts made up 62% of retail options volume, the highest share ever measured against a historical average closer to 43%.
So the crowd showed up, then got nervous, and reached for protection. Both of those moves ask the same thing of you.
You have to be able to look at a position and know what it does.
Pilots fly two ways. Visual, which means looking out the window and trusting what you see. Or on instruments, which means reading dials and gauges because the window has stopped telling you anything useful.
Visual works beautifully until the weather closes in, at which point you switch to instruments or you don’t come home.
Options are permanent instrument weather. You can be right about the company, right about the direction, right about the timing, and still lose money, because there are three or four other dials moving underneath you that never show up in the share price.
Most people trading options right now are flying visual.
The Microsoft Trade
In early July, Microsoft was down about 19% on the year. The market had spent months worried that AI capital spending was a hole with no bottom, and that generative models would eat the software business from the inside.
With the underlying thesis that capital would rotate back into some of these beaten down names, I bought two Microsoft calls expiring December 17, 2027, at the $710 strike, for $11.37 per share.
A note for anyone new to this, because it trips up almost everyone at the start. Options quote per share and trade in lots of 100. That $11.37 quote means $1,136.67 for one contract. (Two contracts, $2,273.34 committed. Not $22.)
Earnings were three weeks out, on July 29. That setup is where a lot of retail money buys cheap calls expiring the following Friday, because they cost a few dollars and the payoff math looks incredible on a napkin.
That trade is a reliable way to be right and lose anyway. Implied volatility, which is the market’s estimate of how much a stock will move, inflates ahead of any event everybody can see coming. You end up buying insurance during the one week it’s most expensive. When the news lands and the uncertainty resolves, that premium deflates and takes a piece of your contract with it. The stock can beat, gap up, and your call can still print red.
You can be correct about the company and wrong about the instrument.
Buying 2027 contracts sidesteps most of that.
A contract with more than a year of life left carries very little of its value in near-term event premium, so the post-earnings deflation glances off it. Time decay is nearly flat that far out, which means a bad month costs almost nothing while the thesis develops. Long-dated contracts are the flat part of the curve, and short-dated contracts are the cliff.
Then came the Microsoft’s Q2 earnings call:
Azure grew 43% and crossed $100 billion in annual revenue for the first time.
Adjusted earnings came in at $4.74 a share against roughly $4.25 expected.
The next day the stock rose 15.5%, the largest single-day market value increase in the history of the stock market. It added 3% more the day after. For the month, Microsoft returned 24.6% while the S&P 500 was flat and the Nasdaq fell 3.2%. It closed Thursday at $499.99, a penny under five hundred dollars.
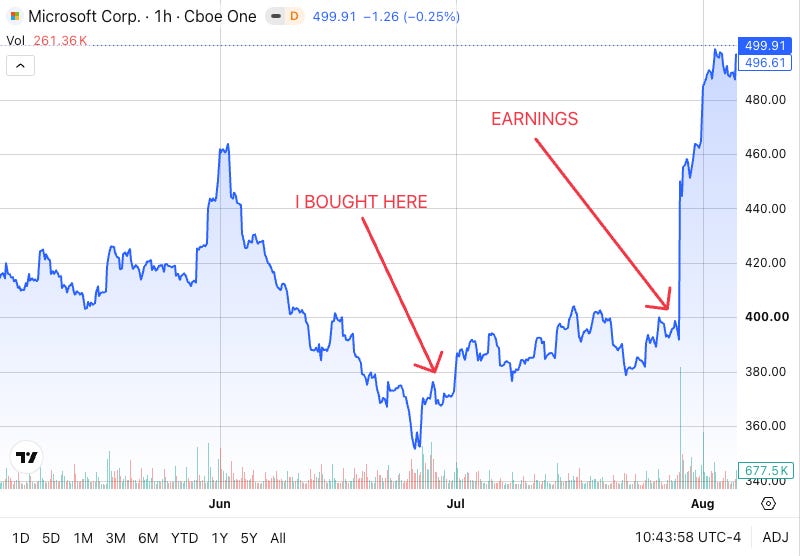
As the old saying goes: “you can’t go broke taking a profit”, so on August 6, I sold one contract at $27.20. Net proceeds were $2,719.28 after commission and fees, a realized gain of $1,582.61 on that contract.
I kept the other one and it’s currently up $1,588.33, or 139.73%.
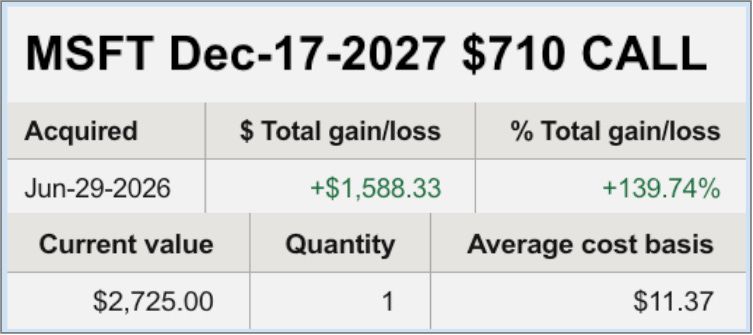
Before going further, the part that belongs next to the number rather than at the bottom of the page. This worked. It did not have to.
Had Microsoft stayed flat or drifted lower, that same structure would have bled toward zero with the same efficiency it gained, and I would be writing about a different outcome with the same conviction.
One position that went well is a teaching example, not evidence of a method. Most retail options traders lose money over time, and nothing about this trade exempts anyone from that.
Why the Performance Gap is Bigger with Options
When I bought these, Microsoft was around $373.
To be worth anything at expiry, the stock had to climb about 90% in eighteen months. That’s a long shot, and the market priced it like one at $11.37.
Today Microsoft sits at $499.99, and the same contract needs a climb of about 42%. Still ambitious, considerably less absurd.
The stock went up 25%. The distance I need it to cover got cut roughly in half.
That’s the trade. A contract on a long shot gets repriced when the shot stops being long, and the repricing runs much faster than the stock itself, because what I own isn’t the stock. It’s a claim on a specific outcome, and the market’s estimate of that outcome improved a great deal more than 25%.
Delta is the dial that measures this.
It tells you how much a contract moves for each dollar the stock moves, and mine sits near 0.28. Twenty-eight cents sounds like nothing until you set it against the $11.37 the contract cost, rather than against a $500 share. That ratio is what an option is.
Leverage you paid for in full behaves differently than leverage you owe.
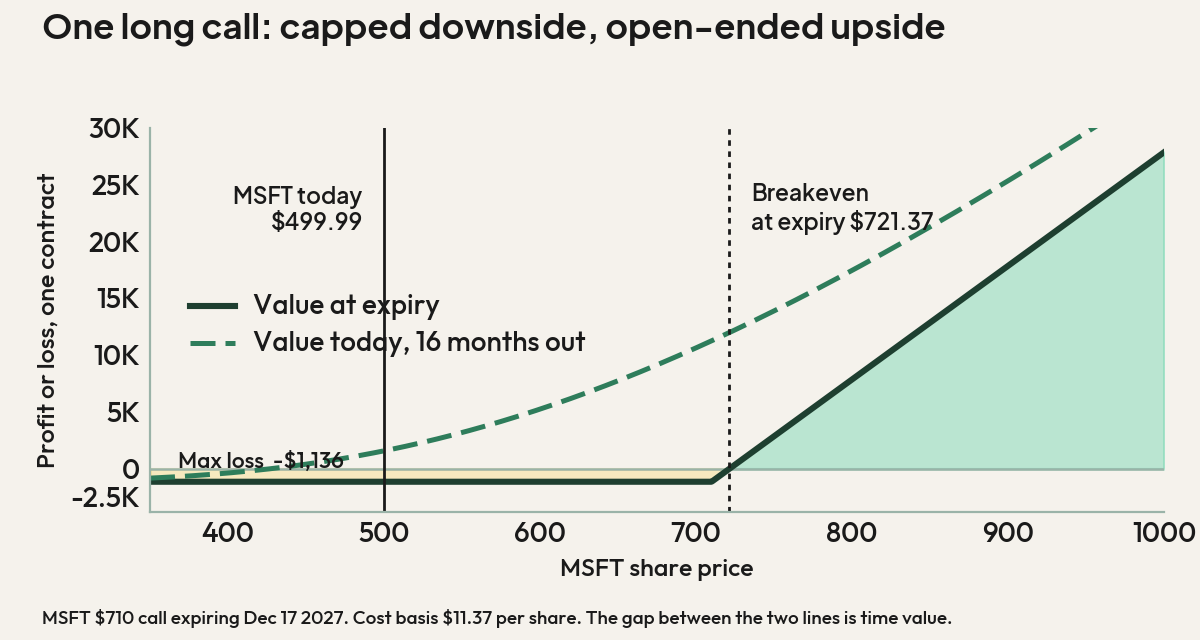
The mechanism is indifferent to direction. Had Microsoft drifted down instead, the distance would have grown, the odds would have worsened, and the same contract would have bled toward zero just as efficiently. I committed $2,273.34 and could have lost every dollar of it. Nothing about the outcome makes the structure safe.
None of this is visible from the share price, which is the point. The window said 25% but the instruments said something else entirely.
Where Crypto Yield Comes From
If you spend time in digital assets you’ve seen products advertising double-digit yield on Bitcoin exposure. MSTY - the YieldMax MSTR Option Income Strategy ETF - and its relatives are the loudest examples.
That yield isn’t interest, and it isn’t staking rewards either.
It’s option premium. Somebody sold calls against a holding and passed the proceeds to you, minus a fee.
Which means there’s a choice most people don’t know they have. You can pay a manager to sell those calls on your behalf, or you can sit in that seat yourself. Same mechanic, opposite side of the table, very different cost structure. Whether that’s fair rent or a bad bargain depends on the asset, because selling calls on something that makes its entire year in six trading days means pre-selling the only days that mattered.
You can’t evaluate any of that without being able to picture the payoff. Which brings me to the thing I built.
What I built, and How to Build Your Own
Single-leg positions are easy to picture, and your broker draws the line for you. Multi-leg is where I lose the thread, and I’ve been doing this a while. Two legs, four legs, different strikes and different expirations, and the combined shape stops being intuitive somewhere around the third one.
So I built a calculator that reads it for me. Type in the legs, see the combined payoff, see the breakeven, see what each Greek is doing to the position today in a sentence I don’t have to translate.
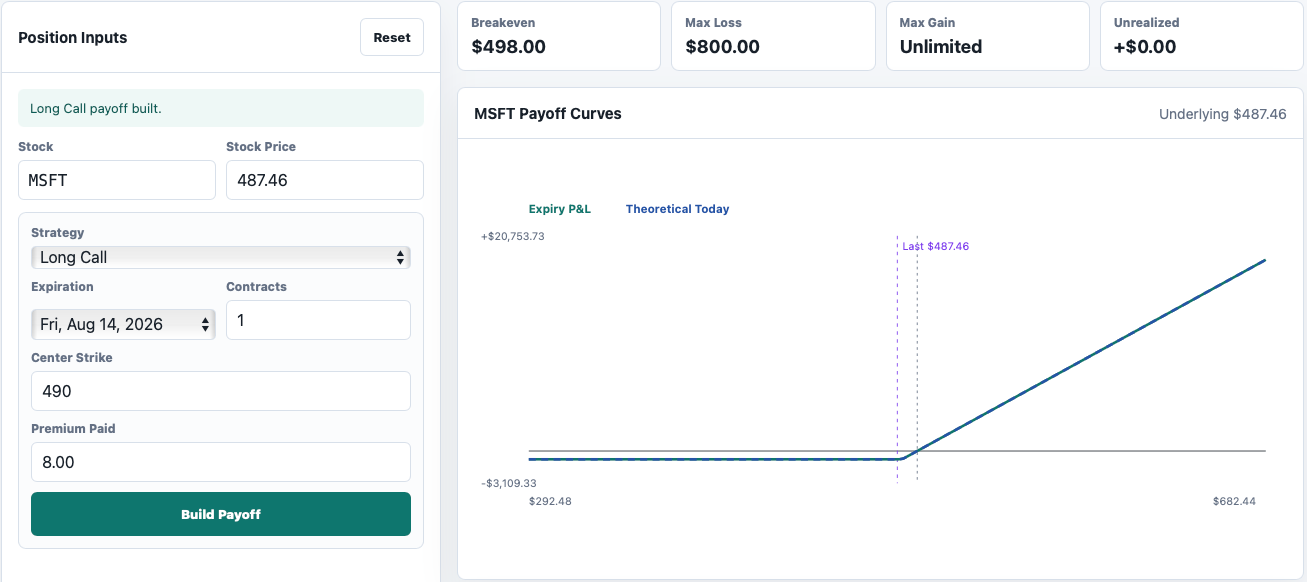
It runs on Alpaca. Their options snapshot endpoint returns the live quote, implied volatility, and all five Greeks in a single call. Alpaca also publishes an official MCP server, which means you can wire your own AI assistant directly into that data and ask it questions in plain English. I didn’t build the server. I built the calculator and the prompt pack that sit on top of it.
The Greeks get a narrative, not a verdict. Each one renders as a sentence built from your contract’s own numbers. Delta of 0.62 reads as a dollar move in the stock moving your contract about $62. Theta of negative 0.34 with eleven days left reads as roughly $34 of value leaking out per day, at a rate that accelerates into expiry. The tool describes. It never tells you what to do, because that’s your call and nobody else’s.
Use paper trading keys. Alpaca’s paper account is free, and it’s the best place I know to learn this. Build a position, watch it move against real market data, lose nothing while you work out what theta feels like. The same connection that reads market data can also place live orders and exercise contracts, so there’s no reason to point a chat window at real money while you’re still learning the shapes.
The file below isn’t my calculator. It’s a build file you hand to your own AI agent, and it constructs the thing on your machine with your keys in about twenty minutes.
BEFORE YOU DOWNLOAD
This tool is for illustrative purposes only.
Nothing it produces should be construed as investment advice.
The formulas, the data sources, and the outputs can all be wrong.
You should verify every number against your own broker before relying on it.
By downloading this file you agree to treat it ONLY as educational material.
DOWNLOAD THE FREE BUILD FILE HERE👇🏻
Why This is Worth Learning (even if you never trade)
Understanding options is how you come to understand leverage everywhere else. Insurance contracts, mortgage prepayment rights, employee equity, venture financing terms, the renewal clause in a commercial lease, the structure of an executive comp package. All of it is optionality priced and sold. Once you can read one contract you start seeing the same skeleton in things that never called themselves derivatives.
That’s the case for learning this, and it holds whether or not you ever place a trade.
The July surge in put buying suggests a lot of people are purchasing protection at rich prices without a clear view of what they’re paying for it. That is the failure a calculator addresses, and it is the only failure a calculator addresses. Making a position legible is not the same as making it wise, and the two get confused constantly.
Still, the crowd is here. Eighteen billion contracts a year says so. The people who learn to read the instruments will do meaningfully better than the ones squinting out the window.
Optionality is worth having.
Optionality you can’t see is worth less than you think.
In Case You Missed It…

A $45 Billion AI Fund Just Got Liquidated Like a Crypto Trader (August 5)
Leopold Aschenbrenner’s Situational Awareness fund was up 439% net for the year through June, running roughly $45 billion at its peak by borrowing three to four dollars for every investor dollar and layering options on top, long “physical AI” names like SK Hynix and Bloom Energy against short software positions.
Illiquid private stakes, including $3.5 billion of Anthropic, couldn’t be repriced or seized on a margin clerk’s timeline, so they’re still standing while the liquid book is gone.
Market Winners 🏆
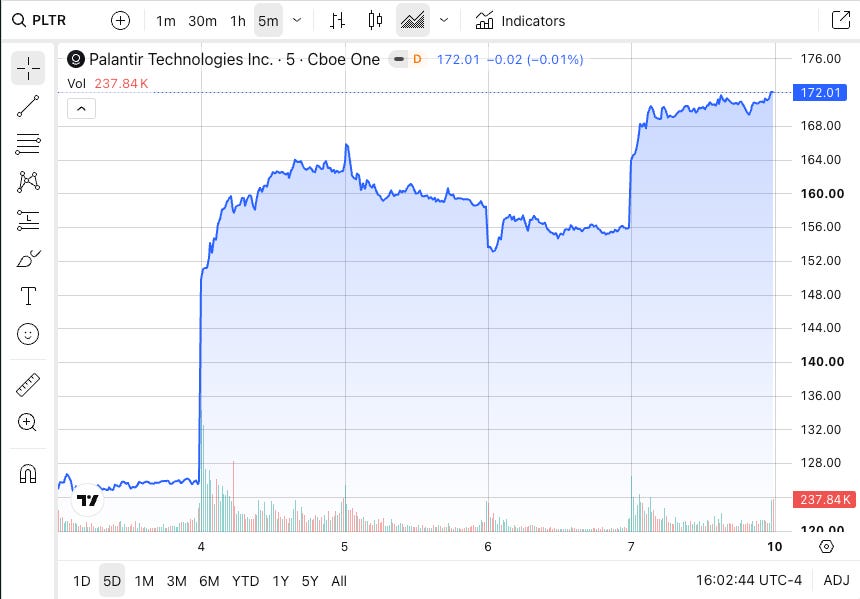
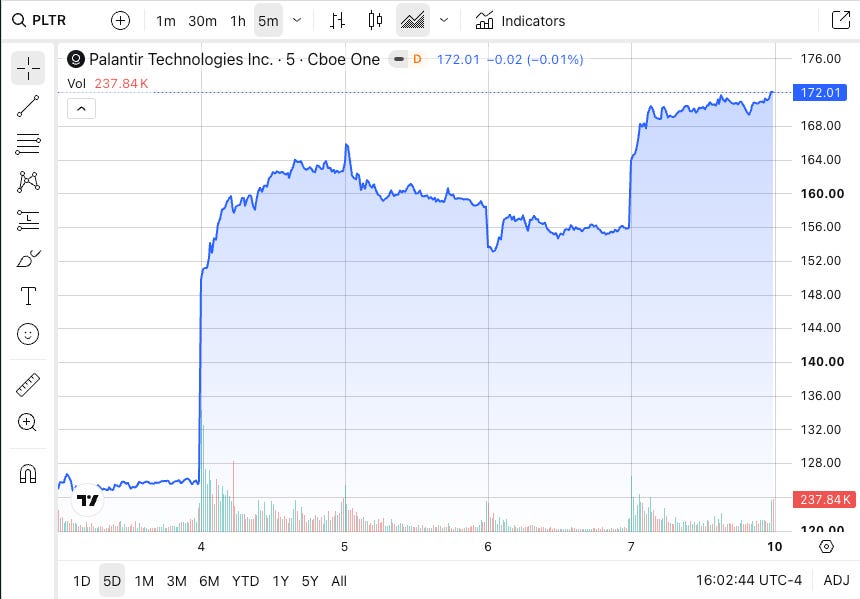
Palantir (PLTR). The stock surged 12% after revenue of $1.94 billion beat the $1.80 billion consensus, up 93% from about $1 billion a year ago, with US commercial revenue up 149% to $764 million and full-year US commercial guidance raised past $3.42 billion. Notably, the print also cleared the $1.797 to $1.801 billion guidance range flagged in last week’s brief by a wide margin. Investors should care because Palantir is the clearest demand-side receipt in AI software: customers, not capex, drove the number. (not a bad week…👇🏻)
Eli Lilly (LLY). Shares jumped 6.5%, with one analytics service quoting the day’s gain at 9.48%, after revenue of $22.97 billion crushed the $20.73 billion estimate on 48% growth, adjusted EPS of $8.38 beat $6.01 expected, and the company raised full-year revenue guidance on relentless Zepbound and Mounjaro demand. Investors should care because Lilly is a trillion-dollar company still compounding revenue at 48%, and because it proves the receipts rule extends beyond AI: show the demand and the market still pays for it.
Disney (DIS). The stock rose about 3% after beating fiscal third-quarter estimates and announcing a content-sharing deal to bring short-form TikTok videos onto Disney+. Disney entered the week down more than 12% for the year, so a beat plus a distribution deal was enough to start repairing the chart. Investors should care because streaming economics improve when someone else’s platform feeds you engagement, and because a consumer bellwether beating estimates the same week payrolls went negative complicates any clean recession narrative.
Long-dated Treasury bonds. Last week’s loser became this week’s winner. Yields fell across the curve after the jobs miss, with the 10-year at 4.639% and the 2-year sliding to 4.193%, its lowest since July 17, pulling long-duration bond prices off the lows they hit when the 30-year touched its highest yield since 2007 a week ago. Investors should care because the swing shows how fast duration risk cuts both ways, and because falling yields did as much for this week’s equity records as any earnings report.
Market Losers This Week 📉
AMD (AMD). The stock dropped 8.5% despite adjusted EPS of $1.66 on revenue of $11.54 billion, both ahead of estimates, with in-line guidance of about $13 billion. The complaint was capital spending: investors balked at the cost of AMD’s buildout even with the beat in hand. Investors should care because AMD confirms the pattern Meta established the week before, where the market punishes spending it can’t trace to a customer, and chips are no longer exempt.
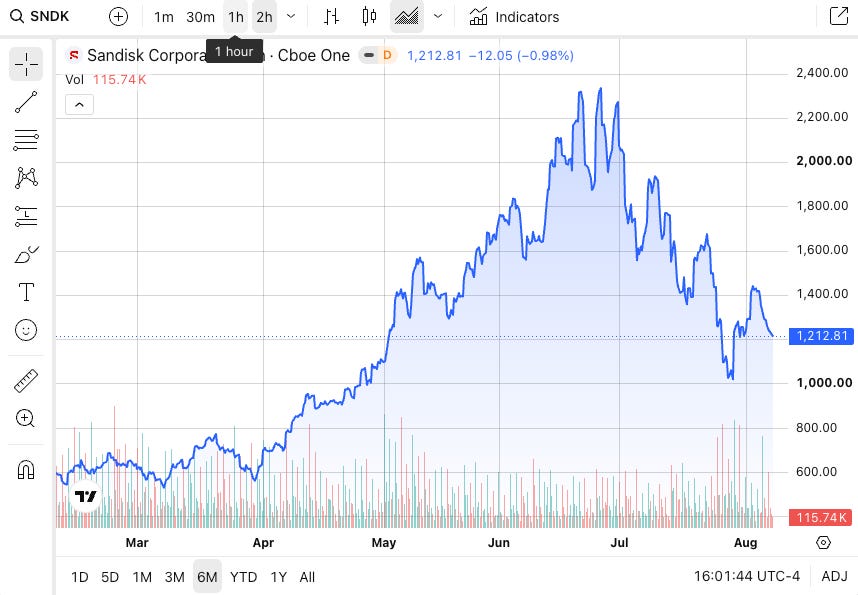
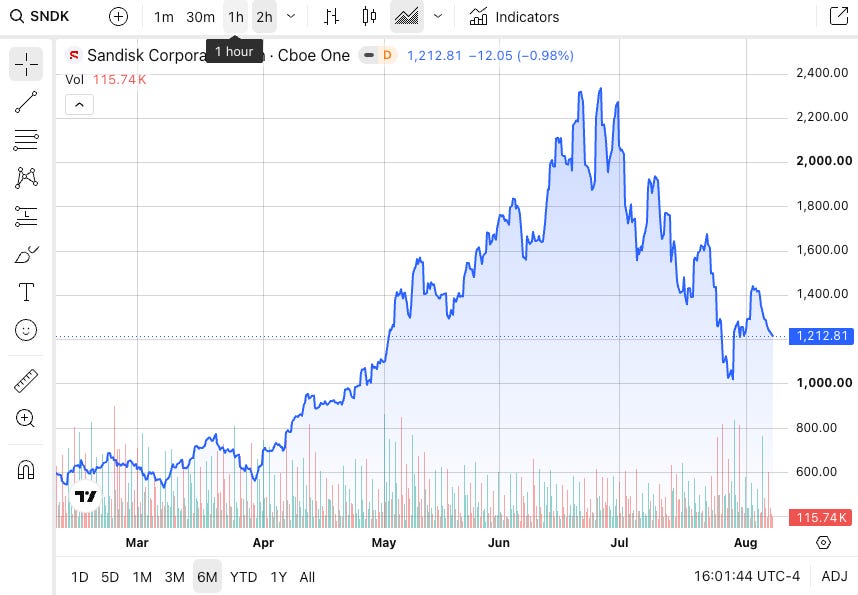
SanDisk (SNDK). Shares fell about 8% premarket after quarterly revenue rose 372% to $8.97 billion but guidance came in soft. Memory was the market’s hottest trade earlier this year, and SanDisk was at the center of it, so a guidance wobble carried outsized weight. Investors should care because momentum names price perfection, and 372% growth losing to its own forecast is the cleanest illustration this month of expectations mattering more than results.
Crude oil. Crude retreated toward $80 during the week as reports emerged of a deal in the works to reopen the Strait of Hormuz, a steep comedown from Brent’s peak above $112 in late July, and falling energy prices pressured the sector even as they flattered the inflation outlook. Investors should care because last week’s brief noted that a meaningful share of this quarter’s S&P 500 earnings growth was a war premium, and the bill for that borrowed strength comes due the moment tankers move freely again.
What to Watch Next Week 👀
July CPI (Wednesday, August 12, 8:30 a.m. ET). The jobs report argued for stopping; inflation gets to disagree. The Fed’s three dissenters built their hike case on inflation running above the 2% target for more than five years, and a hot CPI print the week after negative payrolls would leave policy pinned between a weakening labor market and sticky prices, the exact squeeze that made the 1970s so unpleasant for both stocks and bonds. Oil’s slide toward $80 should eventually help the headline number, though not by Wednesday.
The AI deleveraging aftershocks. Situational Awareness is liquidated, but Goldman’s data showed hedge funds cutting positions at a three-year-record pace, and de-grossing that violent usually echoes. Watch whether the “physical AI” names the fund was forced to dump, SK Hynix and Bloom Energy among them, hold their post-liquidation bounce of 15% to 25%, and whether any other levered AI vehicle discloses stress. One fund’s margin call is an anecdote; two would be a trend.
PPI and retail sales (Thursday and Friday, August 13-14). Producer prices show whether the oil retreat is reaching input costs, and retail sales deliver the first hard read on consumer demand after a month in which employers cut staff. Disney’s beat says the consumer is fine; negative payrolls say check again. Friday’s number is the referee for that argument, the same job the payrolls report just performed for the Fed.
Matthew Snider holds a Series 65 license. This material is for informational and educational purposes only and is not investment, legal, or tax advice, and is not a recommendation to buy or sell any security. Options involve substantial risk and are not suitable for every investor; you can lose the entire amount you pay for a contract. The author holds a long position in the Microsoft call option described in this article and closed a second identical contract on August 6, 2026 and has previously partnered with Alpaca on published content. No compensation was received for the mentions above. Do your own research and consider consulting a licensed professional about your specific situation.
Sources
Cboe, State of the Options Industry, Q2 2026.
Cboe / OCC data on record single-day volume of over 73 million contracts.
Retail options positioning data, July 2026.
Microsoft fiscal Q4 2026 results, reported July 29, 2026. Adjusted EPS $4.74 on revenue of $90.01 billion; Azure growth of 43%. Link
Microsoft share price action, July 2026: Link
Alpaca Markets, options market data and MCP server documentation. Link
Yahoo Finance: Dow, S&P 500, Nasdaq rise after July jobs report surprises
CNBC: S&P 500 rises to record close Friday and posts strongest week since April
CNBC: Odds the Fed hikes in September tumble following big July jobs miss
CNBC: Stocks making the biggest moves premarket: SpaceX, AMD, Eli Lilly,
The Motley Fool: Eli Lilly Pops and AMD Drops in Mixed Morning Markets
Investing.com: Shopify surges, AMD slides premarket as earnings disappoint
StockInvest: Eli Lilly’s Stock Surges 9.48% Amid Strong Earnings
CoinCentral: Wall Street Mixed as SpaceX, Sandisk, Datadog and Oil Maker
Yahoo Finance: Bitcoin and ethereum prices today, Friday, August 7, 2026
Blockonomi: Bitcoin Surges Past $65K as Weak Employment Data Fuels Rally
KuCoin: Cardano Reaches Record Decentralization in August 2026