Three Metals, Three Stories: What January’s Divergence Is Really Telling Us
Gold is doing its own thing.
Silver is flashing structural warnings.
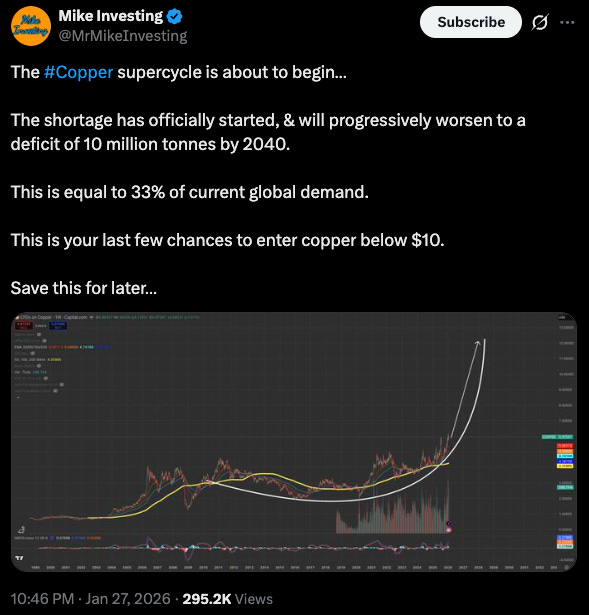
And copper, the metal most investors forgot to watch, may be the story of the year.
Each deserves attention. Together, they paint a picture of a market recalibrating its assumptions about risk, scarcity, and industrial demand.
Gold’s Quiet Rebellion
For years, the narrative was simple: Bitcoin = digital gold.
The thesis is that Gold and BTC would hold hands and move in tandem during periods of uncertainty.
That thesis is being tested.
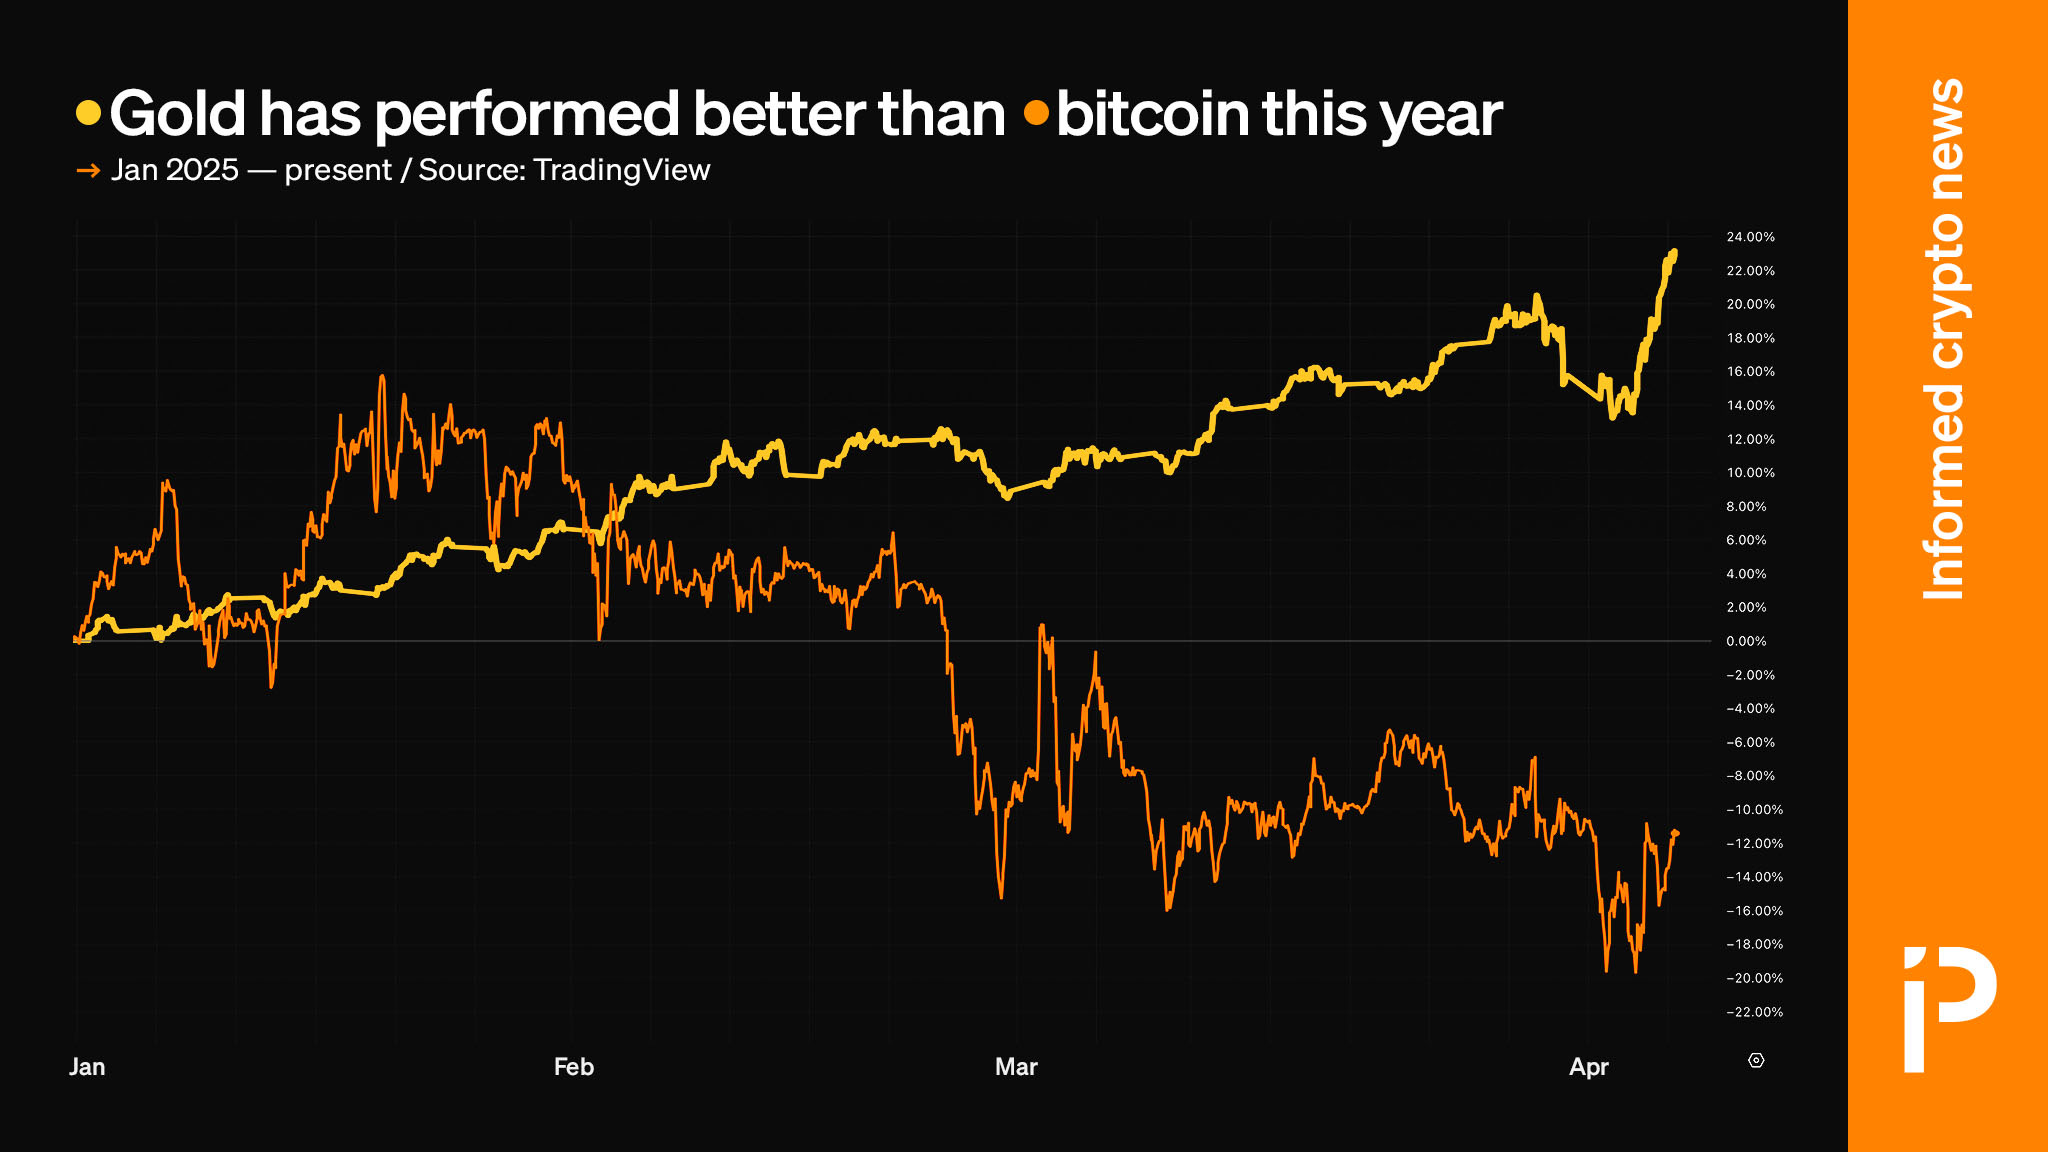
Gold recently crossed $5,000 and continues setting new highs.
Bitcoin, meanwhile, has struggled since Q4 2025, down over 20% from its October peak near $126,000.
The weekly RSI on the BTC/XAU pair has dropped below 30 for only the fourth time in history. The previous instances, January 2015 and December 2018, preceded significant Bitcoin recoveries. Whether that pattern holds remains to be seen.
What is clear is that the correlation has broken.
From November 2022 to November 2024, gold gained 67% while Bitcoin surged nearly 400%. They moved together. Now they do not.
Is the friendship over? I think several factors explain the divergence.
Central banks, particularly in China, India, and Russia, have been accumulating gold. ALOT of it and at unprecedented rates.
Institutional trading desks still categorize Bitcoin alongside the Nasdaq as a risk asset. When equities sell off, Bitcoin tends to follow.
Gold does not carry that correlation.
Some analysts point to quantum computing concerns affecting Bitcoin’s risk profile. Others note that the positive catalysts driving Bitcoin’s 2024 rally had already been priced in by January.
Whatever the cause, the “digital gold” narrative needs revision. Bitcoin may eventually deserve that title. But Q4 2025 demonstrated it has not earned it yet.
For allocators, the takeaway is straightforward: these are different instruments serving different functions. Treating them as interchangeable creates portfolio risk that may not be obvious until it matters.
Silver’s Paper Problem
Silver presents a more structural concern. The COMEX is showing signs of strain that deserve serious attention.
In just seven days during early January, 33.45 million ounces of silver were physically withdrawn for delivery. Put another way…26% of COMEX’s registered inventory disappearing in a single week. Gone. Poof.
Open interest in near-month contracts has been rising even as deliveries occur, an unusual pattern suggesting participants want their metal sooner rather than later.
The numbers tell a troubling story.
Silver demand has outstripped supply for four consecutive years. The Silver Institute projects 2025 will be the fifth. The structural deficit reached 148.9 million ounces in 2024 alone. Over the past four years, the cumulative shortfall totals 678 million ounces, equivalent to ten months of global mining supply.
Here is where it gets uncomfortable.
Trading volumes in paper silver have dwarfed physical inventory at ratios reaching as high as 356 to 1.
When futures contracts begin failing to deliver, when inventories in London and New York drain faster than expected, when lease rates spike to 8%, the pricing mechanism itself comes under pressure.
Analysts have observed an unusual pattern: investors appear to be rolling March contracts backward to January and February. If accurate, that suggests market participants do not want to wait for physical delivery. They want it now. For smelters, refiners, and industrial users who depend on reliable silver supply, this creates operational risk that extends well beyond portfolio management.

Not everyone agrees the situation is dire.
Some analysts argue silver’s price is driven primarily by speculation and recurring shortage narratives rather than genuine scarcity, pointing to Sprott Physical Silver Trust trading at a discount to NAV as evidence.
That debate will resolve itself. The COMEX data suggests the resolution may come sooner than comfortable.
Copper: The Wildcard Everyone Forgot
While gold and silver capture headlines, copper may be the most consequential story unfolding in metals markets.
A new S&P Global study frames it starkly: the emerging copper supply deficit constitutes a “systemic risk for global industries, technological advancement and economic growth.”
That is not promotional language from a mining company.
That is institutional research.

The numbers support the concern.
J.P. Morgan projects a global refined copper deficit of approximately 330,000 metric tons in 2026. Production growth has slowed dramatically, with refined output expected to expand just 0.9% this year versus 3.4% in 2025.
In China, which dominates global refining, smelters are planning cuts exceeding 10% due to margin pressure and concentrate shortages.
Demand, meanwhile, continues accelerating.
Data centers are extraordinarily copper-intensive facilities. The buildout of hyperscale AI infrastructure has created copper intensity levels rivaling traditional electrification applications.
S&P Global projects copper demand reaching 42 million metric tons by 2040, a 50% increase from current levels. Supply cannot keep pace. Global production is projected to peak in 2030 at 33 million metric tons.
The supply side faces structural challenges that defy quick solutions. Declining ore grades, rising extraction costs, environmental opposition, and lengthy permitting processes create long lead times. The average timeline from copper discovery to production is 17 years. Whatever shortfall emerges in the next decade was already baked in years ago.
For investors seeking copper exposure, several ETFs provide access to the theme:
Global X Copper Miners ETF (COPX) offers exposure to 41 copper mining companies. Assets total $4.56 billion with a 65 basis point expense ratio.
United States Copper ETF (CPER) tracks copper futures contracts on the COMEX. Assets total $460.7 million with a 106 basis point expense ratio.
iShares Copper and Metals Mining ETF (ICOP) provides diversified exposure to approximately 50 mining companies at a 47 basis point expense ratio.
Mining equities carry operating leverage. When copper prices rise, miners tend to outperform the underlying commodity because their costs are largely fixed. That pattern may re-emerge if structural shortages intensify.
The Framework
Three metals, three different dynamics. Gold is reasserting its role as the original store of value while Bitcoin finds its footing. Silver’s paper market is testing physical reality in ways that may force a reckoning. Copper, essential to everything from AI infrastructure to electrification, faces a deficit that existing supply chains cannot address.
None of this requires prediction. It requires attention. The data is available. The question is what you do with it.
— Matthew
X: @matthew_mba_
Want to level up your life?
Read more.
We took 1,300+ pages of wisdom from the Oracle of Omaha and condensed it into a snackable, easy-to-read guide for digital asset investors. Pick up your copy today!